What Is TargetTAKS? |
TargetTAKS is a Grade Analysis Program That will get your school ready for the TAKs test. It is being used to
evaluate student performance in preparation for the TAKS test. Students are given three pretests over the school year to
access their performance, therefore allowing the teachers to evaluate
target areas that need more work prior to the actual TAKS test. Teachers
have been doing the analysis manually for their classes and campus administrators have combined the data
to get an accurate picture of how the campus fairs. TAP will replace the manual job for teachers giving
them more time to look at the data rather than compile it. |
1. Student Testing: |
Teachers administer the pretests in a similar environment to that of the
actual TAKS test. This not only accomplishes the needed task of evaluating
the students' abilities, but gives them practice time to become accustomed to
testing procedures. |
2. Test Scanning: |
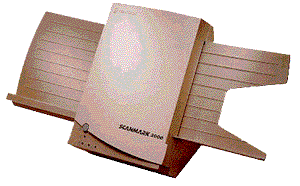
The scan administrator will process the test forms. This is done with the use of a Scantron Scanmark 2000
OMR reader. Each test is scanned and the data for that student is uploaded to the district database. It
is stored there for future use and backed up daily. The information will remain from year to year to allow teachers
to compare how they do from year to year and to also see a student's progress throughout his or her career. |
3. Teacher Evaluation: |
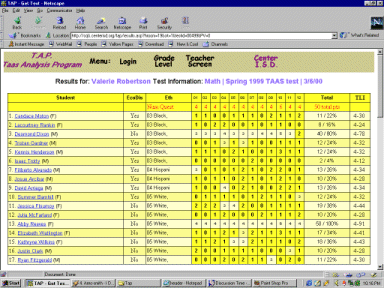
Once a test is scanned, the teachers get immediate feedback on their students. This information comes in a variety of forms. RESULTSThis page will show the teacher how each of his/her students did on the
TAKS objectives as a group. It will point out the students that did not master certain areas and allows the teacher
to see the exact answers that a student gave as well as evaluate each question at the class level. Teachers can print of view this screen to evaluate student effectiveness.
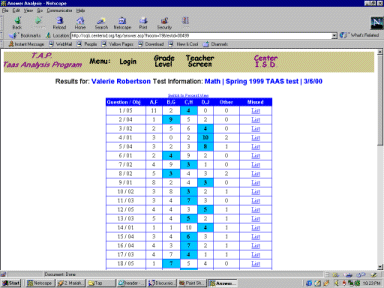
ANSWERSThis page shows the various answers given for each question on the test. The correct answer
is denoted with a different color. This allows the teacher to see if there is a pattern in wrong choices.
CHARTThis page charts the progress of students passing for the class showing breakdowns based
on gender, ethnicity, GT, ESL, and economic status. GRADE LEVELThe Answers and Chart pages are available at a GRADE LEVEL for the campus administrator to view how the campus did as a whole. These pages were created using the Active Server Pages interface of
Microsoft Windows NT with Internet Information Server. The code was written using a combination of HTML, VBScript and SQL.
|


